Search & Code Browsing
Unified search
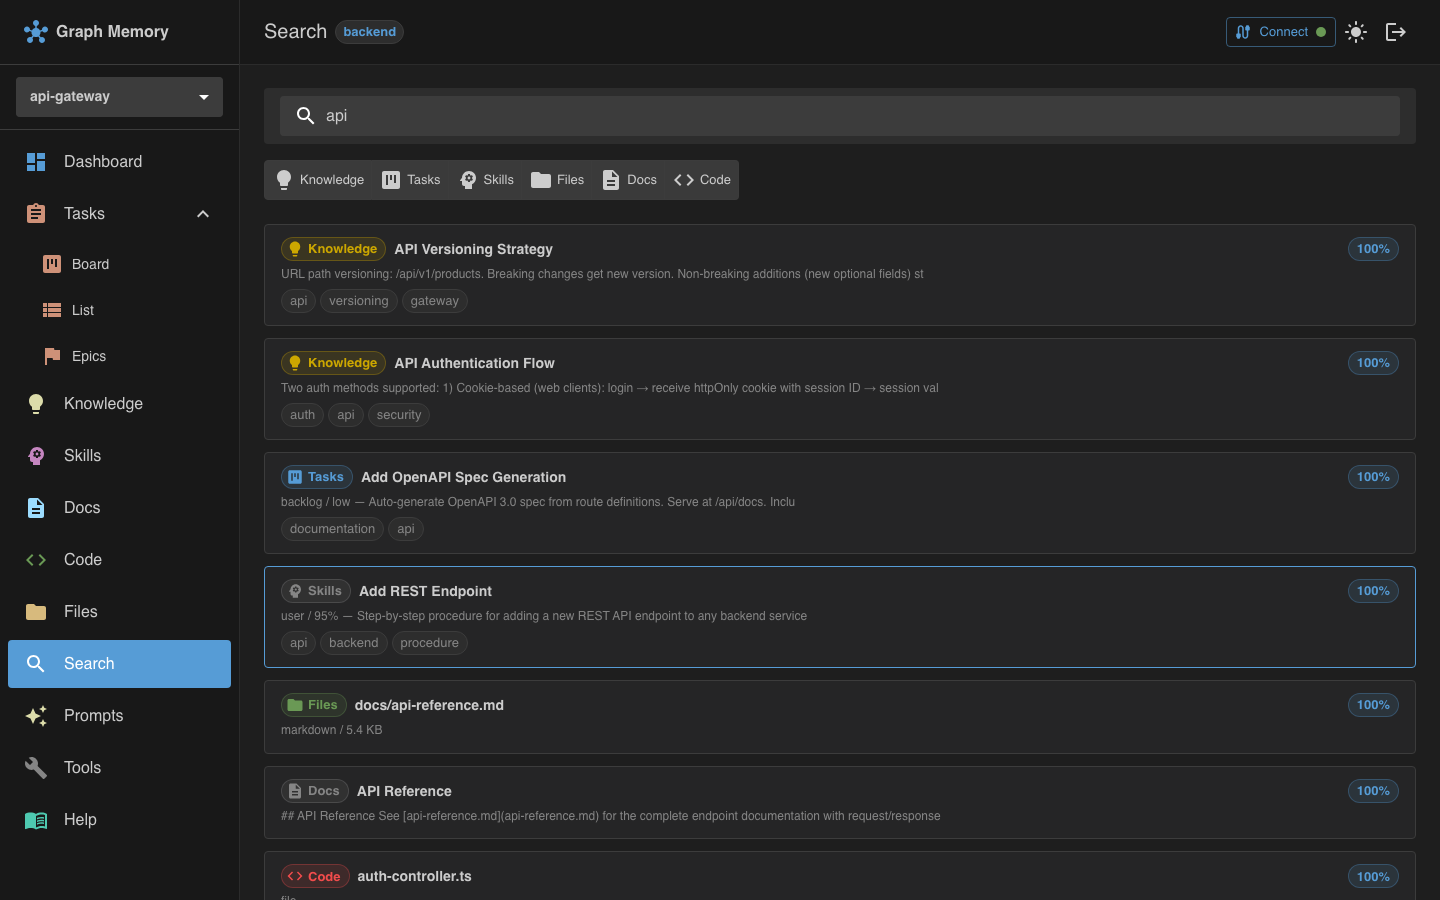
The Search page provides a single search box that queries all graphs simultaneously. This is the fastest way to find anything in your project.
How it works
Type your query and press Enter. Graph Memory runs a hybrid search combining:
- BM25 keyword matching -- finds exact and partial term matches
- Vector cosine similarity -- finds semantically related content even when different words are used
Results are fused using Reciprocal Rank Fusion (RRF) and expanded via graph traversal to surface connected nodes.
Scope toggles
Above the results, toggle buttons let you enable or disable individual graphs in the search. For example, you can search only across documentation and code, or only within the knowledge graph.
Grouped results
Results are organized by graph type:
- Docs -- matching documentation chunks with file path and heading
- Code -- matching functions, classes, and interfaces with file location
- Knowledge -- matching notes with title and excerpt
- Tasks -- matching tasks with status and priority
- Files -- matching files with path and metadata
- Skills -- matching skills with name and description
Each result shows a relevance score. Click any result to navigate to its detail view.
Code browsing
The Code pages (/code and /code/:symbolId) let you browse all indexed code symbols extracted from your project's TypeScript and JavaScript files.
Symbol list
The main code page (/code) displays all indexed symbols -- functions, classes, interfaces, and type aliases -- with search and filtering. Each entry shows the symbol name, kind, and source file path.
Symbol detail
Click any symbol to open its detail page (/code/:symbolId), which shows:
- Symbol name, kind, and source file location
- The full source code of the symbol
- Cross-graph links to related docs, notes, tasks, and other symbols
- Navigable references to other symbols in the same file or project
Code search results from the unified Search page link directly to these detail pages for quick navigation.
Tools explorer
The Tools page lets you browse and test all 70 MCP tools directly from your browser, without needing an AI assistant.
Tool list
Tools are organized by category (docs, code, knowledge, tasks, skills, files, cross-references, search). Each tool shows its name and a short description.
Live execution
Select a tool to see its full description and input schema. Fill in the parameter fields and click execute. The tool runs against your live data, and the result appears below along with the execution duration.
This is useful for:
- Testing -- verify a tool works as expected before using it from your AI assistant
- Debugging -- inspect tool output when troubleshooting MCP integration
- Exploration -- discover what each tool does and what data it returns
Tools that require write access are only shown if your user account has the appropriate permissions. See Access Control for details.